Nesta
EdTech usage during the
pandemic: A story in four
graphs
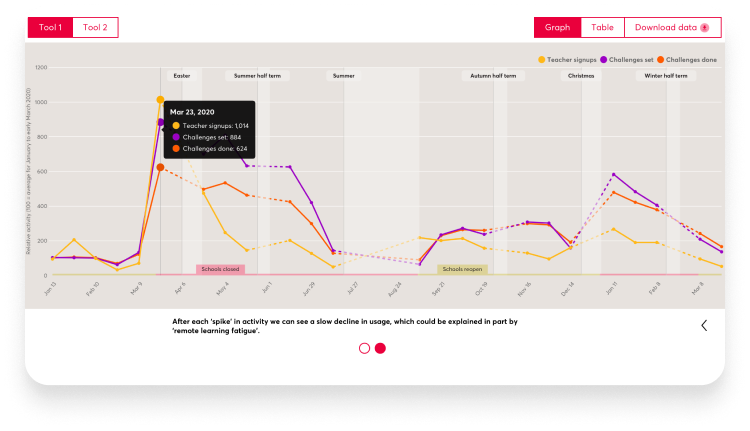
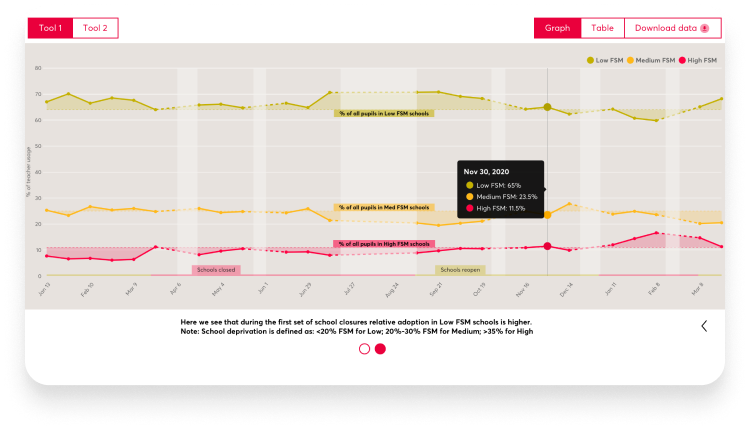
A series of interactive graphs to show how EdTech was used during the pandemic.
Case study coming soon


A series of interactive graphs to show how EdTech was used during the pandemic.
Case study coming soon

