Nesta
Design the future
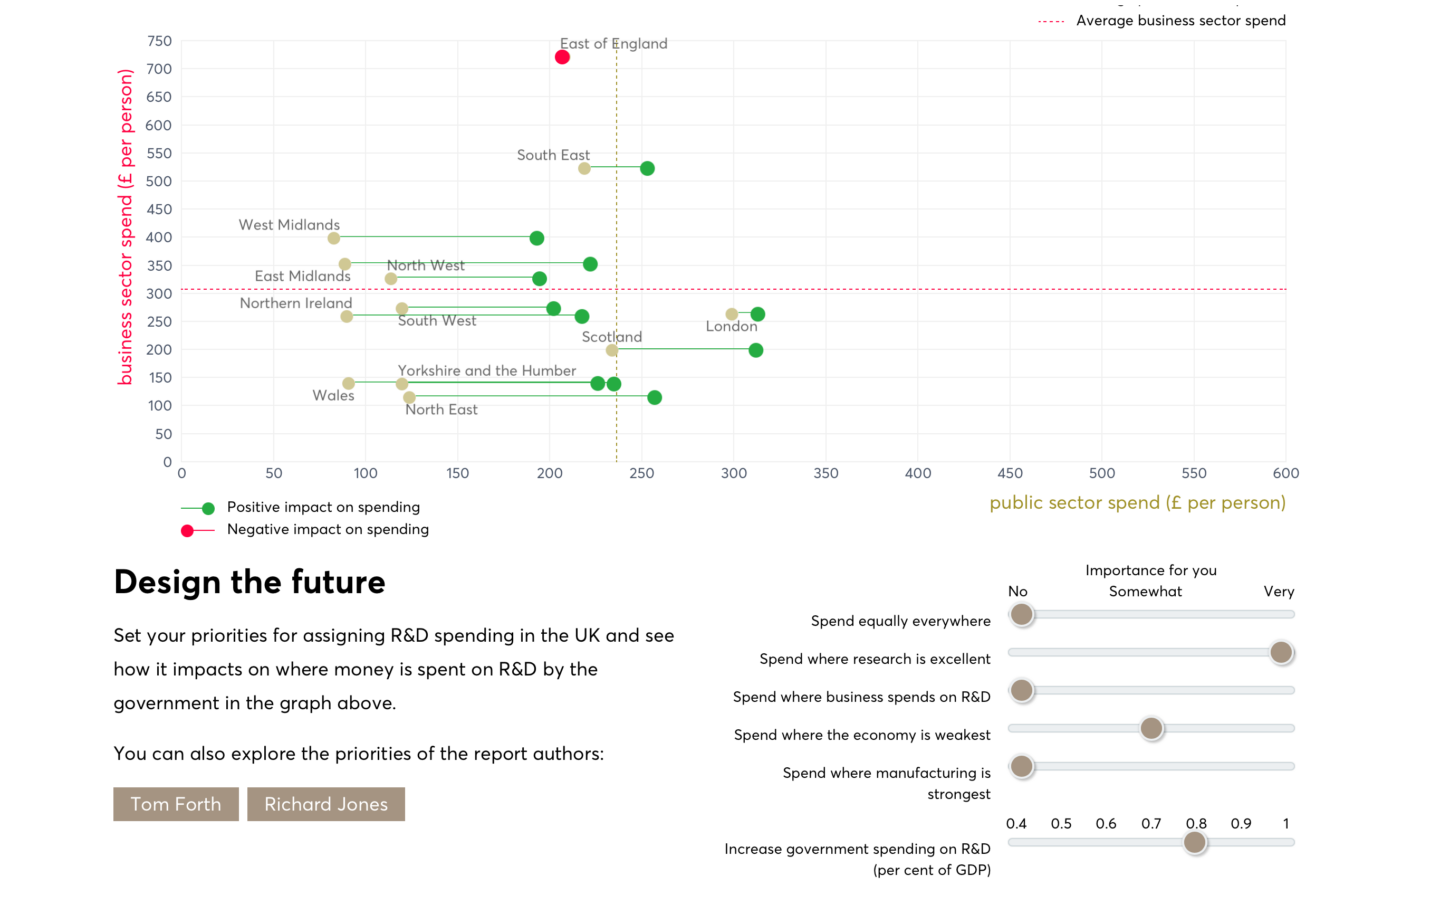
An interactive data visualisation telling the story of R&D funding
We worked with Nesta to provide a route into their research on how R&D funding is distributed across the UK. Initially asked to create some graphs to show the headline facts. Instead, we suggested turning this into an interactive scrolling story.
This format allows the casual reader can scroll to understand the key points, while the more interested reader can interact with the graphs to dive deeper into the data.
The analysis of historic spend is coupled with a tool that lets the user set their priorities for assigning R&D spending in the UK and see how it impacts on where money is spent.
We used gsap to help us transform elements as the user scrolls around.
This lets elements transition from bar charts to stacked charts to dots without the need to clear the canvas and bring in new elements.